Companies that rely on a data-driven decision making process put data warehousing at the core of their approach. To be able to provide decision makers with trustworthy, facts-based and rigorous information, the data warehouse has to be, among other things, consistent and scalable.
I have been working in business intelligence for quite some time now and it is a common occurrence for BI professionals to have long meetings and discussions on answering a simple question: what is the best way to build a data warehouse that meets specific requirements, such as flexibility, performance and scalability. Many large companies that operate in traditional industries such as finance, communication or utility have been investing for decades in building these types of infrastructure. But for many up-and-coming, young companies that wish to have a proper BI infrastructure, this is a serious question. Often times when these questions arise, 3 options are put on the table: go traditional and build a simple and straightforward data warehouse following the principles laid down by Ralph Kimball, take a bit more risk and go for a much more cost intensive and complex solution as described by Bill Inmon or get on the train and ride the ‘modernity’ wave by building a data warehouse based on the data vault modeling techniques described by Daniel Linstedt.
If none of the names I just mentioned ring a bell, you shouldn’t worry too much. Even BI professionals who have been in the industry for years, whether in technical or functional positions, have hard times trying to reconcile all the literature, concepts and theories related to data warehousing. This is the reason why I am writing this article: to give an overview of the different architecture and modeling techniques that are used when building an enterprise-level data warehouse. The focus here will be to explore 3 of the most popular techniques of data warehousing and explain the specificities related to each one of them.
What is business intelligence
Before diving straight into the question, it is important to take a small step back and define what exactly is business intelligence and why it is such a hot topic in the corporate world and in academia. The simplest way to explain what Business Intelligence is lies in understanding how companies handle their customers’ data.
Let’s have a look at the following scenario: you are on an online store trying to purchase a gift for a loved one. You select your desired product and when you’re ready to make your payment, you introduce all the information details related to yourself and submit. To be able to process your order, the merchant puts in place an infrastructure that is not only able to handle the transaction and deliver your product, but also collect all the information you just provided and store them in databases for processing purposes. Your single purchase gives the merchant valuable information about yourself: where you live, what is your age, your gender, what type of products you bought, where you bought them, how much you spent and so forth. Once you consider that the merchant can handle hundreds of thousands of similar transactions on a regular basis, you realize how much of a strategical value all this data could have and how it could benefit the company on a broader scale. Think about the merchant being able to determine what products sell more, to which gender, in what point of sale, to which demographic, etc. The value of being able to go through the data and extract valuable information that help the business innovate and grow is infinite.
Business intelligence is the combination of various techniques that are used to extract and collect operational data (such as a sale) or any other types of data, transform and analyze them in order to provide valuable insights with the goal of helping management take better decisions. ‘Analyzing the data’ can be done in many different ways and there is a significant segment of business intelligence that is specifically focused on this topic alone. The most common types of analysis include: descriptive analytics, predictive analytics and prescriptive analytics.
Why build a data warehouse
We have seen in the previous scenario that merchants possess databases that are used to store transactional data which are then processed so that management can have an overview of all of the company’s data in order to make sound decisions. The question that we should provide an answer to is: how do we manage to provide management all this information? I mean, how do we go from storing a sale transaction in a database to building a report on a dashboard specifically curated for a specific business need?
The first thought might be to simply connect whatever analytical application being used by management to the transactional databases and compute whatever KPI necessary on-the-go.
Primitive BI architecture
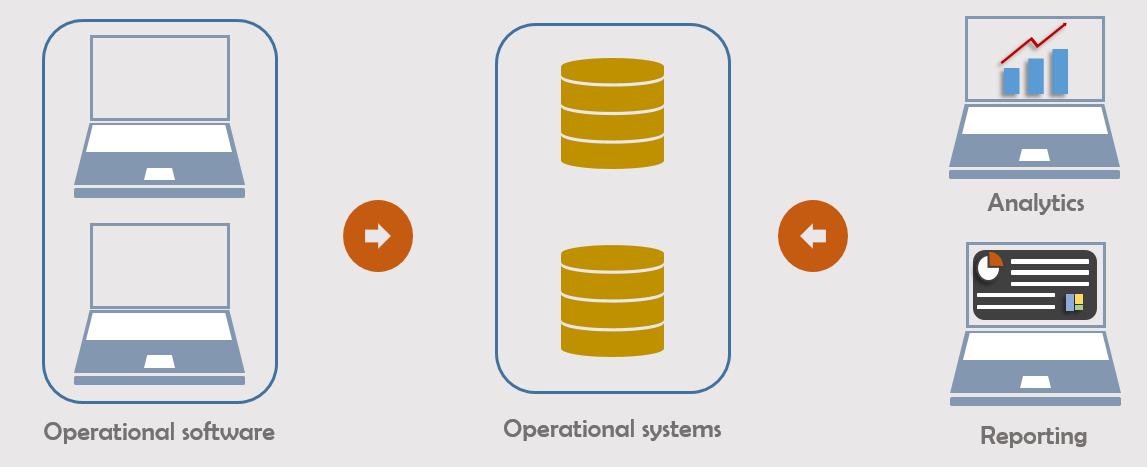
Although this approach might have certain benefits, such as providing management with real time data, it would have a huge burden on operational databases. This is because management would be more interested in viewing aggregated and filtered data which, when combined with frequent querying of operational databases, would lead to a significant decrease in performance on both ends. Needless to say that, technically, this would be the least preferable solution.
“The data warehouse is at the core of business intelligence: it provides a consolidated, constant, non-volatile and time-variant version of enterprise data“
The right solution would be to create a system that eliminates this burden from an operational perspective and creates layers specifically designed for reporting purposes. The system that makes this possible is called a data warehouse.
Data warehouse architecture
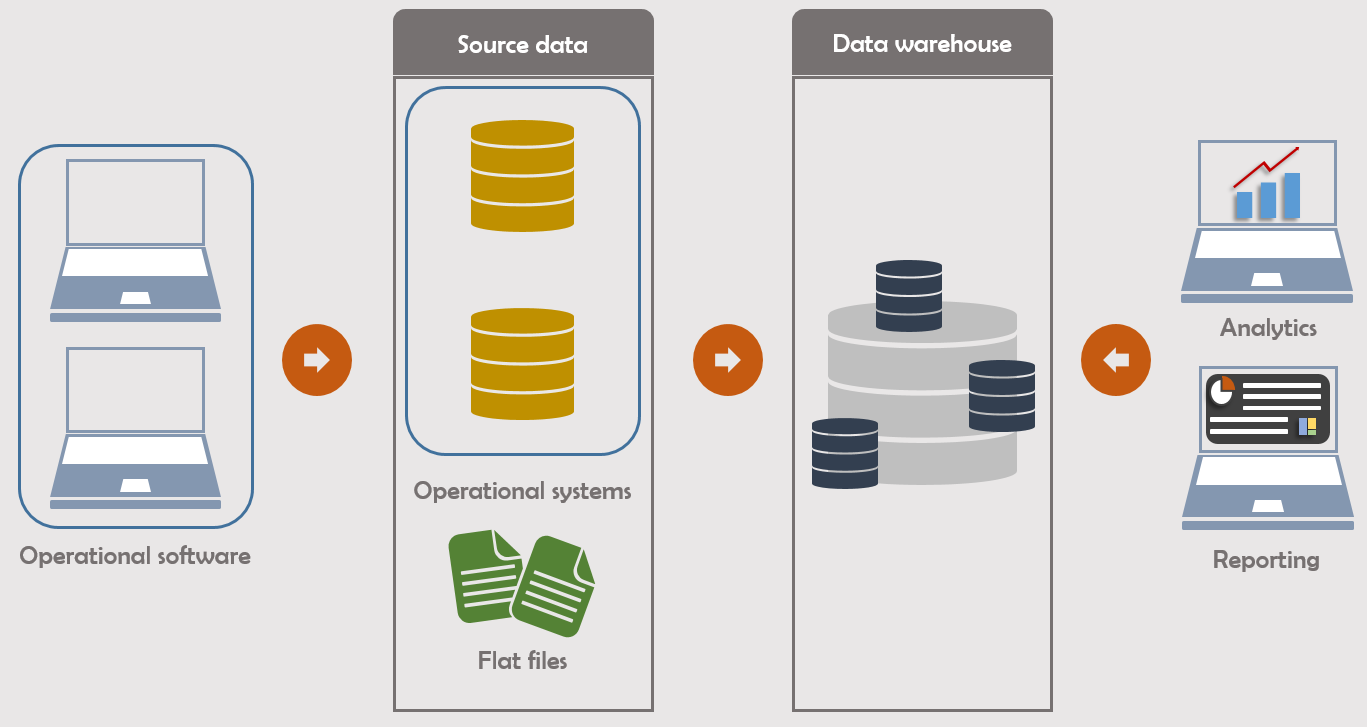
The data warehouse is at the core of business intelligence: it collects raw operational data and after various transformation are applied to those data (cleansing, filtering, aggregation), it presents them to various end users for the purpose of analysis or reporting. The data warehouse has the ability to ingest any types of data, whether it is from operational systems (CRM, ERP, SCM, HRM…), flat files (csv), unstructured data (NoSQL) or semi-structured data (XML, JSON). Because it provides a consolidated, constant, non-volatile and time-variant version of enterprise data, the data warehouse is at the center of any corporate strategy that aims to take full benefit of analytical transformation.
BI terminology
In the previous sections, I have used terms like ‘operational systems’, ‘analytical applications’ or ‘operational databases’ to describe some aspects of the Business Intelligence framework. All these terms may be confusing when no context is clearly laid out as to where each one of them intervene in the end-to-end flow of data. I will give an explanation of the most commonly used terms in Business Intelligence in this section to provide more clarity.
The Business Intelligence flow starts right when data is created, meaning when the front-end user introduces information in a software. Depending on the business or the operation, this could be any action that represents a day-to-day operation of the company, such as making a sale, registering a customer, registering new stock of goods and so on. Any software that allow these types of operations to occur is called ‘operational application’. Some of the well-known of such applications are the SAP suite, Microsoft Dynamics or even Microsoft Excel.
The data that is generated by operational applications are stored in operational databases, or more commonly referred to as ‘source databases’. Most of the times, BI professionals use the term ‘transactional systems’ or OLTP (Online Transactional Processing) to describe both operational applications and databases.
The data stored in operational databases have to be extracted, transformed and loaded into the data warehouse. This process is referred to as ETL (Extract, Transform & Load). As we will see later on, the same process is also used to move data between the different layers of the data warehouse. There is an abundant amount of technology that is used today for ETL purposes, the most popular ones being SQL Server Integration Studio, SAS Data Integration, Informatica, Talend or IBM Datastage.
In data warehousing, depending on the architecture that is in place, it may occur that instead of using ETL techniques, BI professionals turn to ELT (Extract, Load & Transform), where data is extracted from a source system, loaded into the storage layer and transformation is applied later on. This is generally the case whenever there is no middle area between the source databases and the reporting layer of the data warehouse, such that any transformation occurs right when data is queried from the reporting layer. Because most analytical applications require that data is transformed and prepared before ingestion, ETL is the go-to method for moving data in data warehousing while ELT is most commonly used for creating and loading data lakes, which are different types of data stores that do not require data being transformed before ingestion.
As already mentioned, after all transformation are applied and data is ready for exploitation, they are made available on a specific layer to which analytical applications connect to create reports, dashboards and make any other type of analysis necessary. The market is full of various technologies aimed at creating reports, dashboards and analyses; the most popular ones being Power BI, SQL Server Analysis Services, Tableau, Qlik, Oracle BI EE or SAP Business Objects. All the different techniques, technology and services used for data analysis are commonly referred to as ‘analytical systems’.
How data warehouses are built
Now that we have laid out the concepts and terminologies, let’s examine the different architectures and modeling that are used to build modern data warehouses.
The two-layer approach
Ralph Kimball laid down the foundation of what is today the most widely used architecture in data warehousing. His approach is based on the principle of dimensional modeling with a bottom-up architectural approach: key process identification comes first, then additional process are added later.
The Kimball model can be summarized like this: the raw data coming from the source systems are loaded into a staging area, which is a denormalized physical layer with close to no transformation that contains historical data. Using ETL, the data is extracted from the staging layer, transformed and loaded into a reporting layer that is separated in different data marts, each one of which contains data at the atomized level and is modeled after the dimensional modeling technique. Analytical applications are then plugged onto this layer in order to create analyses and dashboards.
Kimball’s architecture
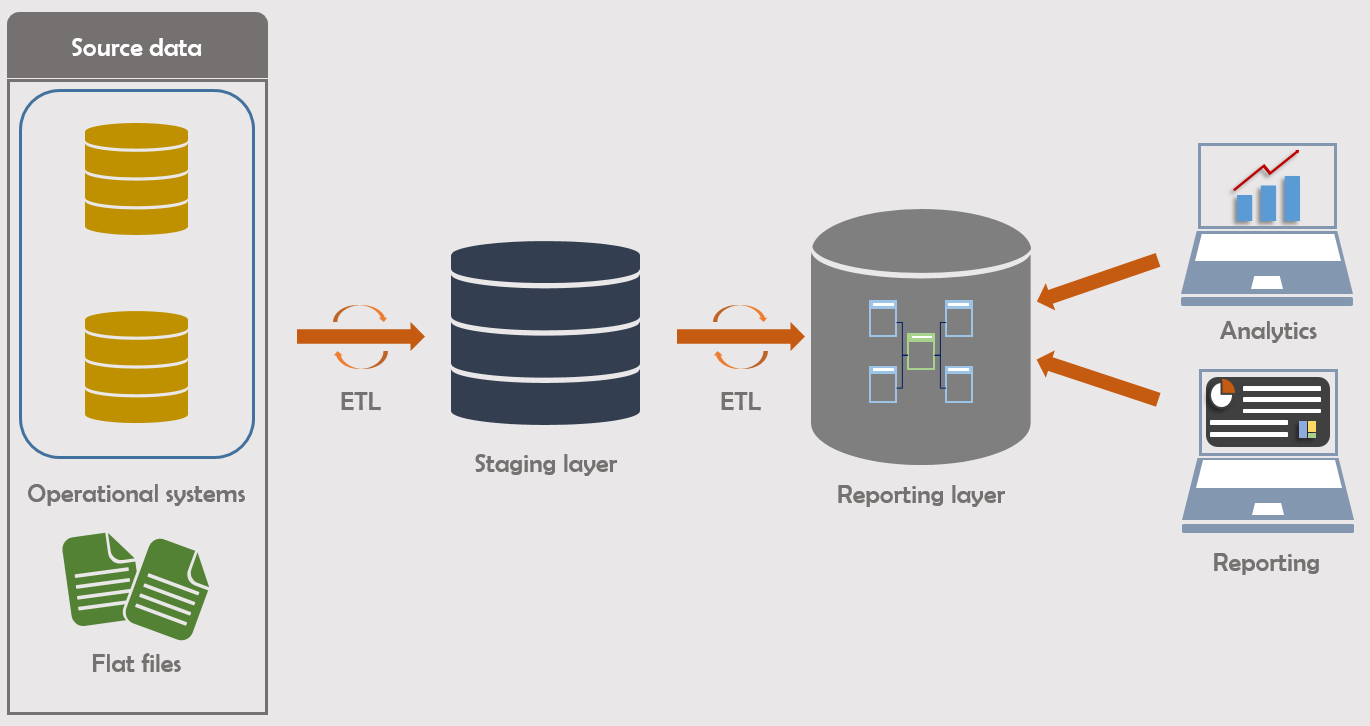
Dimensional modeling is the standard method that most analytical applications use to read data from reporting layers in order to create and build reports. This technique is built around the principle that each data mart should contain a fact table that stores different quantitative measures of business processes. Each fact is connected to one or more dimension tables (via technical or business keys) containing contextual information about each measure stored in the fact. In the case of the online store that we presented earlier for instance, the fact could store records about each amount of sale that has occurred while dimensional tables could contain information about the cashiers, the products or the point of sale. This technique is most commonly referred to as the star schema model.
The technical implementation of a star schema is out of scope of this article. I will, however, give a bit more details about a very known variation of this model in a later section.
The three-layer approach
This method was first developed by Bill Inmon and unlike Kimball, the architectural emphasis could be described as top-down: the data warehouse should be envisioned as a central structure holding all of a company’s data in which a normalized layer is essential to consolidating all information. As such, it is essential that enterprise data be separated from department-specific data. Enterprise data should be consolidated in a specific centralized layer that is called the enterprise data warehouse, which is modeled based on the entity-related model (ER Model) and normalized on the third normal form. The department-specific data should be made available through department-specific data marts.
Inmon’s architecture
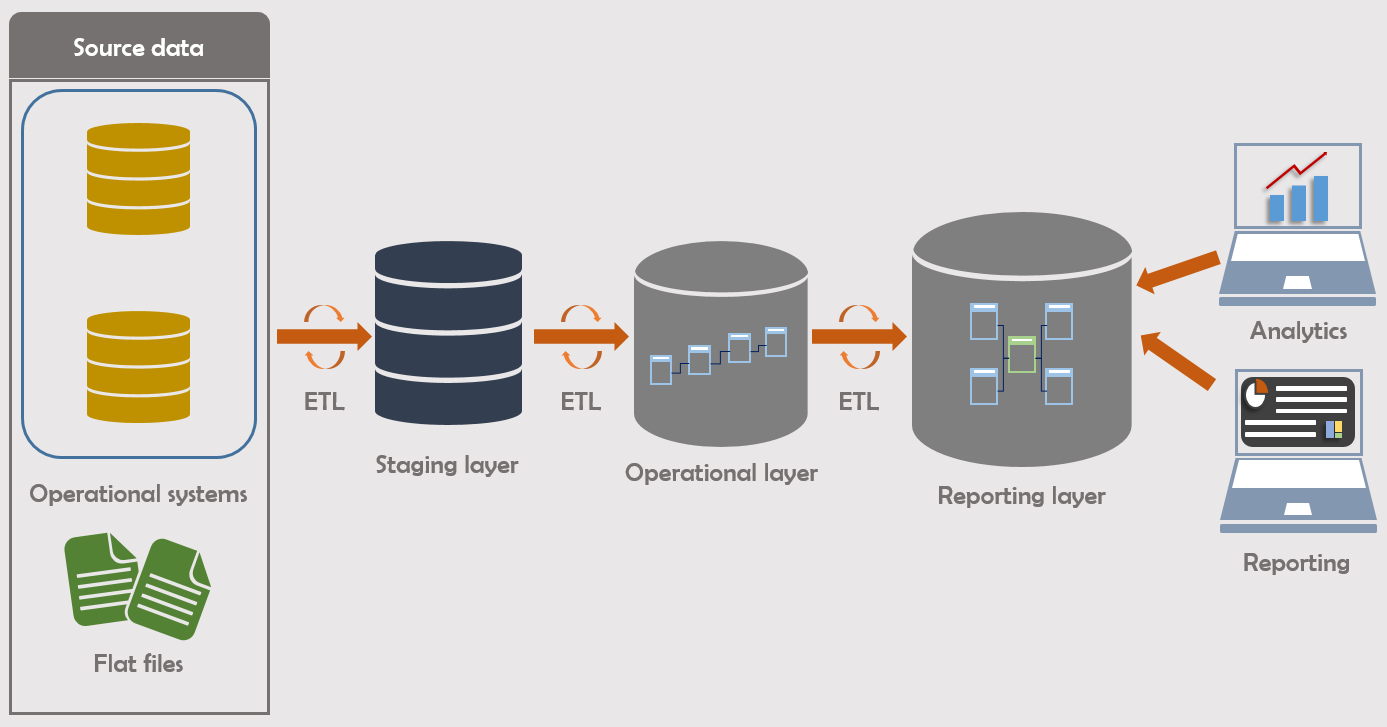
Notice that Inmon also envisions a staging area that has the same characteristics as the one from Kimball: denormalized, historical data and close to no transformation of source data.
Like Kimball, Inmon’s data marts are also modeled based on the dimensional modeling technique. However, data is stored on an aggregated level and access is very subject-oriented: each data mart is built for a specific subject area and its access should be strictly limited to clearly defined users.
Data vault 2.0 modeling
The last modeling technique that I will cover is data vault 2.0, introduced by Daniel Linstedt in the late 90’s. He argues that conventional architectures (i.e. Kimball & Inmon) fail in one important area: they are very rigid and offer very little opportunity for extension. Therefore, in an environment where companies face difficult challenges due to ever changing regulations, combined with the increase of the size and the complexity of data, there should be a need to rethink how data warehouses are built.
Linstedt’s architecture is very similar to the one from Inmon in that he envisions 3 layers: a staging area, an operational layer and a reporting layer made up of data marts.
Linstedt’s architecture
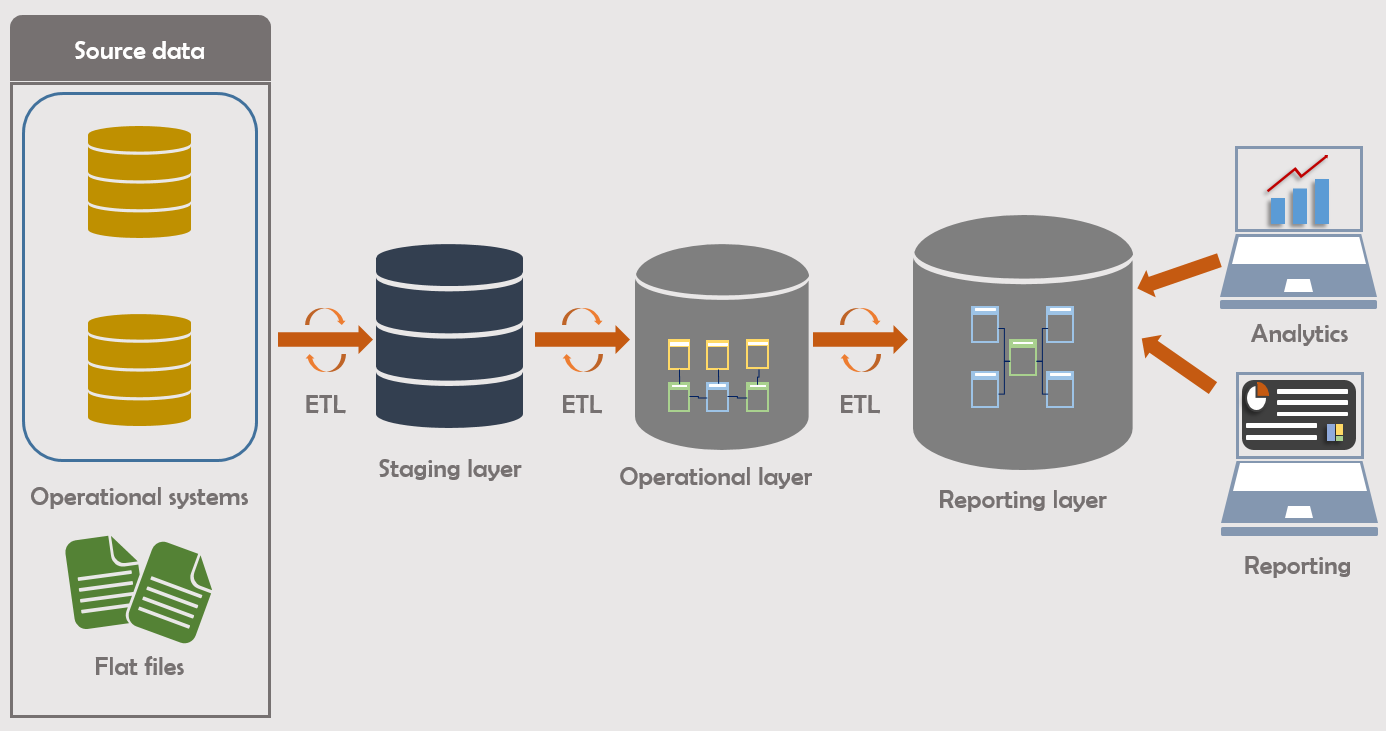
The biggest difference however with the previous architecture is on how the operational storage layer is modeled:
- The staging area remains denormalized. However, historical data is no longer maintained and no transformation is enforced
- The modeling of the operational storage layer is based on the Data Vault 2.0 modeling technique. This layer is now called the Raw Data Vault
- The reporting layer is still based on the dimensional modeling technique and contains business-oriented aggregated data
- Many optional layers are also envisioned in order to manage various metadata:
- A ‘Metric Vault’: captures runtime metadata
- A ‘Business Vault’: captures information where business rules are applied
- An ‘Operational Vault’: Captures information that are fed into the data warehouse from operational systems
We will not explore those optional layers in this article.
I guess from the description above you get that the main talking point of this approach is the medialization of the Raw Data Vault. The data vault 2.0 technique requires the creation of various tables called hubs which contains critical business keys related to each business line of the company. Each one of these hubs is connected to another hub via their respective keys and these relationships are stored in tables called links. Finally, additional tables called satellites are created in order to store contextual information related to each one of the hubs or the links. Regarding the online store for instance, we could have hubs storing business keys related to products, cashiers or clients; link tables that connect each one of the hubs and then satellites containing contextual information related to each one of these hubs and links.
The technical implementation of a data vault 2.0 modeling is out of scope of this article.
Star schema: extension to snowflake
I explained earlier that dimensional modeling is central to data exploitation for reporting purposes. This technique is generally based on a star schema model where a central fact table is linked to multiple dimensional tables. The name ‘star schema’ comes from the fact that the model looks like a star when all tables are arranged around the fact table.
Star schema modeling

Because this model is very denormalized, one of its main advantages is that exploring data does not require complex SQL, which increases queries performance.
The star schema is prefered whenever the tables in the model have quite straightforward relations between them, generally having the fact and the dimension tables on a 1-n relation (a row in the dimension table referencing 1 or more rows in the fact table). However, whenever the relation between the fact and the dimension is more complex, like in the case of a n-n relation type (multiple rows in the dimension table referencing multiple rows in the fact table), it is recommended to build a bridge table between the two in order to recreate a 1-n relation.
Snowflake schema modeling

This extension is called the snowflake schema because once the tables are rearranged around the fact table, the model gets the same look as the one of a snowflake. With a higher degree of normalization, this model may require the creation of more complex queries, leading to a decrease in performance.
Next steps
Although we just covered the 3 main architectures and modeling techniques for building a modern data warehouse, it is important to keep in mind that every company implements its own interpretation of the data warehousing theory in accordance with the specifics of its business and its needs. Therefore, you can except to come across a company that has the basics of what is laid out in this article, but with additional details that makes sense to themselves.
It is also important to note that besides the 3 techniques I just presented, there are many other that are in use today, especially with cloud services vendors providing already-built data warehouses such as Amazon Redshift, Azure Synapse Analytics or Google BigQuery. Those technologies will be the subject of a future article.

